'Graph' Tool
In the 'Graph' tool screen, you can perform functions such as selecting a target curve or manipulating the data displayed on the graph.
Target Selection Interface
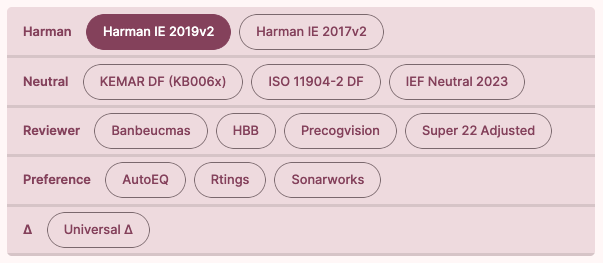
In the target selection interface, you can select the Target Curve to use when comparing frequency response measurements.
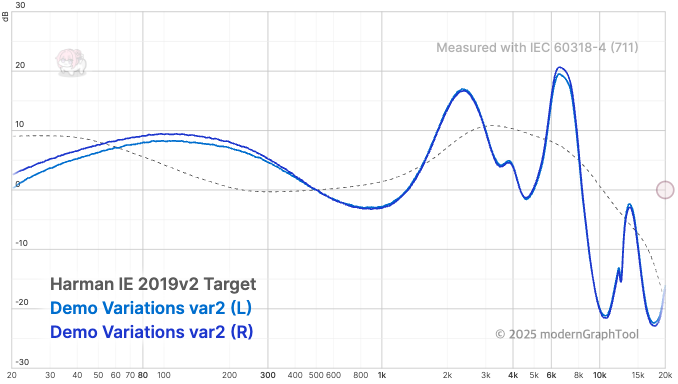
The target curve is typically displayed as a gray dotted line graph.
Graph Manipulation Buttons
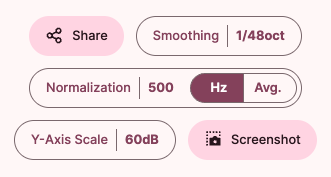
Sharebutton: Creates a link to share the currently displayed graph.Smoothingbutton: Allows you to display the graph's curve smoothly or closer to the original form.- You can select from 1/48 octave to 1/3 octave. The default value is 1/48 octave, and the graph becomes smoother as the value increases.
Normalizebutton: Allows you to set the criteria for aligning the currently displayed graphs.- 'Hz': Aligns all graphs based on the frequency of the entered value.
- 'Avg': Aligns all graphs based on the average SPL value between 300Hz and 3000Hz.
Y-axis Scalebutton: Allows you to set the Y-axis scale range of the graph.Screenshotbutton: Allows you to save the current graph as a screenshot.